
How to Read a Balance Sheet? The 6 Most Important Steps.
Do you know how much money you would have if you sold everything in your business and paid all your bills? Understanding the balance sheet is an essential skill for every business owner and it will give you answers to the above. At What a Figure! Accounting we will review the main steps on how to analyze this financial statement to get the most out of it.
Step 1. Understand the Balance Sheet equation.
In order to be able to read a balance sheet, you should understand first the essence of this report.
The balance sheet represents the financial position of the company on a particular date. This statement shows an organized list of assets, liabilities, and equity that are grouped by common characteristics.
In other words, the balance sheet can tell you what you own and what you owe.
So, let’s take a closer look at the structure of the Balance Sheet:
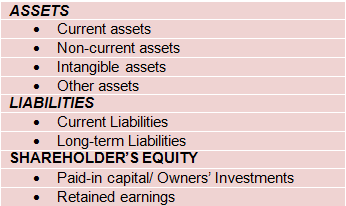
The connection between each section of the balance sheet is reflected by the fundamental accounting equation:
Assets = Liabilities + Equity
This equation means that each asset you own always has a source of origin: it was acquired by your own money (equity) or by borrowed funds (liabilities). Understanding of this rule is the first step in reading the balance sheet.
Step 2. Review Your Assets
Just like when it comes to personal finances, assets are all those essential things you use to maintain your living: a house or apartment, a car, and even money on your credit card. Some of these things you may own, others may be borrowed.
The common characteristics of your assets (both personal and business) are that you can financially benefit from them now or in the future.
Reading the Balance Sheet starts with reviewing the current assets section.
To start with, current assets are the most liquid assets your business owns.
Liquidity is an ability of an asset to be converted into cash.
For example, an office building is not a liquid asset because it may take a lot of time to sell it and get cash instead. However, inventory is highly liquid as it could be converted into cash within a short period of time.
Current assets usually comprise of:
- Cash on hand and in your bank accounts. Also, this includes cash equivalents that can be quickly converted into cash.
- Inventory you have in your warehouse – we will review this more closely in the next step.
- Accounts receivables – amounts that are usually due in 30 days (depending on terms offered to customers), therefore, classified as current assets.
- Prepayments – money you’ve paid in advance and are expected to receive some service or product in the nearest future. For example, if you’ve prepaid for the office rent for one year this is classified in your balance sheet as a current asset.
- Accrued Revenue – what you earned but haven’t invoiced yet.
The next section you will see while reading the Balance Sheet is Non-current Assets that includes:
- Fixed assets are physical property you own and have a useful life longer than one year. For small e-commerce businesses fixed assets on the Balance Sheet may consists of a single computer.
- Long-term securities: Investments that can’t be sold within one year.
- Intangible assets are used in the operations of the business but have no physical substance. Examples of these are patents, copyrights, and franchises.
As you can see the assets are classified based on the time required to convert them into cash. Analyzing the assets structure could be useful for assessing the company’s solvency.
Step 3. Inventory Balance Analysis.
We would like to highlight an inventory overview as a separate step of the balance analysis. If you are running an e-commerce business, then the inventory cycle is the most crucial thing. Buying too much inventory (or the wrong products) may cause losses. At the same time, if you don’t buy enough of the right products you can lose money again. You simply wouldn’t be able to fulfill the potential demand and therefore give the way to your competitors.
As an e-commerce business owner, your task is to find the right quantity of the right products to sell. Your success as an e-commerce seller starts with an understanding of inventory turnover.
Inventory Turnover Ratio is calculated as COGS divided by the average inventory for a period. So you should look both at the P&L and Balance sheet to pick up these numbers. As a result, you’ll find out how many times inventory is “turned” or sold during a period. The higher this ratio is the better it is for your business.
Let’s look at it through a practical example:
In the beginning of the year, opening inventory was $ 45k, the closing inventory was $52k. The annual COGS reported was $300k.
First of all we should calculate the average inventory:
($45k + $52k)/2 = $48.5k
Then simply divide COGS by average inventory:
$300k/$48.5k= 6.18
At first glance, this ratio doesn’t tell you a lot: is this result of 6.18 a good or a bad indicator?
Let’s do the following to get a better understanding:
365 days/6.18 = 59 days.
So, the ratio of 6.18 means that it takes 59 days to sell ALL our inventory. In other words, your inventory took 6 “turns” during the year.
Inventory turnover can be one of the most important financial ratios for e-commerce business owners to monitor. It measures the liquidity of your inventory and can help to determine how to increase sales. Low inventory turnover means that you invested too much in inventory. You spent too much money on acquiring a product you can’t sell out quickly. Also, don’t forget about the costs associated with the storage of these items.
In this case, you are losing out on potentially more profitable investments.
With a better understanding of the Balance Sheet, you will have better answers to the crucial questions each e-commerce seller searches answers for:
- Which products are selling the best?
- How many do you need to maintain stock levels?
- How much inventory to order next time?
Step 4. Look At The Liabilities Section
As we mentioned earlier in regards to personal finance, not all things you use are your private property. Maybe you rent an apartment or pay the mortgage for your house. Or repay a loan to your bank with interest. Rent payments, mortgage, and loan for your new car are examples of personal liabilities.
As a rule of thumb, remember that each asset needs to have a source of finance. If we haven’t acquired it with our own money (eg. reinvested the income), then we are dealing with borrowed funds we owe to third-parties (eg. banks). Therefore, you should always be aware of your liabilities and thoroughly analyze them.
A big chunk of cash in your checking account may give an impression that the business is thriving. It could be a great misconception without looking at your debts. Always look at your liabilities thoroughly to assess the vitality of your business.
Liabilities include:
- Accounts Payable – what you owe to your suppliers.
- Accrued liabilities – these are expenses incurred but not paid yet (eg. supplier hasn’t invoiced you yet). You should account for it too in order to get an accurate picture of your financial position.
- Wages Payable – what you owe to your employees.
- Unearned revenue for services paid for by customers but not yet provided (this might need to be refunded)
- Loans and interest on loans
- Deferred tax liabilities
In the balance sheet, all liabilities are divided into current and long-term liabilities depending on the time when they fall due.
Step 5. Review Equity. What could it tell you?
The Equity section of the company includes a few different parts (as below). It gives the owner and other investors the understanding of how the business is financed. So let’s look at the 2 main sections:
Paid-in capital is combination of money and other assets that have been invested by the company’s owners. Usually, the owners (shareholders) in exchange for invested funds receive shares.
Retained earning is the amount of net profit left after paying out dividends to the shareholders. So, retained earnings are the total net profit remained in the period, accumulated for future needs. A high retained earning figure is a good sign – this means that the business has a reserve that could be reinvested into it’s development or repaying debts that may exist.
A company with a negative retained earnings balance would signal about its weakness, as it shows that the company has experienced losses.
Therefore companies with a higher portion of paid-in capital means the company’s funding comes mainly from investment. Whereas companies with higher portion of retained earnings means the company is making profit and operates on these earnings.
The picture below shows the connection between the P&L and the Balance Sheet:
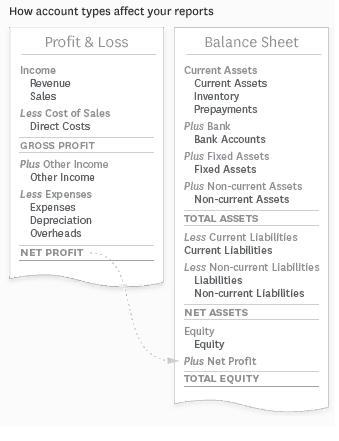
As you can see above, the current period’s Net profit (from the Profit & Loss statement) is shown on the Balance Sheet as part of Total Equity. This is because Net profit is equal to the current period’s Retained Earnings.
Shareholder’s equity could be a positive or negative number. A company with a negative shareholder’s equity figure may be considered risky and therefore unsafe for investors. That’s why this is an important indicator for the balance sheet analysis.
Most e-commerce sellers are sole traders which means that no partners or shareholders are involved. In this case the equity section of your Balance Sheet is very simple and straightforward: you don’t issue shares and pay dividends to investors. It will consist of money you invested in your company and retained earnings after your withdrawals (if there were any).
Step 6. Analyze liquidity and solvency with the Balance Sheet
Once you’ve got an understanding of what each line on the balance sheet means you can move to the next step – calculating financial ratios.
This last step is rather advanced and many small businesses don’t calculate them, let alone very new e-commerce sellers. So if you are just getting familiar with finances, feel free to skim read this section for now and get back to it when you are more comfortable with the rest.
These are main indicators to pay attention to:
Ratio | Formula | Description |
Working capital | Current Assets (CA) – Current Liabilities (CL)
| It is the main measure of a company’s liquidity. If a company has positive working capital (assets excess liabilities), then it should have the potential to grow. If a company has a negative working capital figure, then it may face financial troubles in the future (can’t pay back creditors, or it could even go bankrupt).
|
Current ratio | CA/CL | Shows if current assets can cover current liabilities.The higher is the ratio, the better it is for business. |
Quick Ratio | (CA – Inventories)/CL | By deducting current assets that are less liquid, the quick ratio provides a more diligent indication of the business’s liquidity. A quick ratio that is higher than 1 is generally regarded as safe |
Debt to Equity Ratio | Total Liabilities/Equity
| Compares resources provided by creditors with resources provided by owners. The higher the ratio, the greater the creditor’s capital share in assets, so the higher the likelihood the business is unable to meet its obligations. |
Debt to Total Assets | Total liabilities / Total assets
| Shows the percentage of a business’s assets that have been financed by debt/creditors |
The calculation of these core ratios could help to read a balance sheet and get a really deep insight into the company’s performance.
We hope the above article on the balance sheet analysis was helpful. If you have any questions on this let us know in the comments below!