
How to Calculate the Break Even Point? (+free template to build your own scenarios!)
Probably, the most common question every business owner is asking is: “How much (and at what price) do I need to sell products to be profitable?”
Guessing is not the best approach while doing business, even if you have a good intuition;) Luckily, we can use the break even analysis to lower risks and make forecasts.
At What a Figure! Accounting we will cover the following question:
- What is the break even point
- What are methods to calculate it (examples + free break even calculator!)
- What is a Break Even Graph?
- Why this type of analysis is so important and how your business will benefit from it?
What is a Break Even Point and Why Do You Need to Know Yours?
The Break Even point represents the situation when the revenue generated is only enough to cover the company’s costs.
It is a point where the company doesn’t have profit nor loss.
Why do we need it? With this analysis, we can determine the best price and required sales volumes to generate a profit.
Suppose, you are about to start selling a new product. Maybe, you did your research to investigate your competitors’ prices for similar products.
Most people stop at this stage and set prices somewhere close to one’s that exist on the market.
We are not saying it is a wrong approach. Market research is a must. However, a more complex investigation is required if you want to efficiently compete with other sellers.
The most important factors we are going to analyze are costs. First of all, we need to look at our Income Statement because it is a primary report where all costs are grouped and listed.
You might think that it is too complicated to dive into it and as a small business you are not ready to hire someone to do it for you.
No worries, we’ve got you covered: we will review a step-by-step process of calculating your “no-loss-no-profit” point and give you a free template to make calculation for your firm even easier. So, keep reading, there are a lot of useful info ahead.
How to determine your Break Even Point? (+ Free Brek Even Calculator)
The break even point could be calculated based on the following criterias:
- Number of items that need to be sold while the price is constant.
Let’s look at an example to understand how the break even point is calculated using this method.
Imagine that you are selling T-shirts.
The information needed for the company to determine its breakeven number of units (T-shirts in our case) is as follows:
- Variable costs per unit
- Fixed costs
- Sales price per unit
Your monthly fixed costs are $1000, they are always constant and don’t change whether you make any sales or not. You sell T-shirts for $20. Also, you have calculated that variable costs per each T-shirt are $15. Having these figures we can easily calculate break even units:
Break-Even Units = Total Fixed Costs / (Price per Unit – Variable Cost per Unit)
Brek Even Units = 1000/(20-15) = 200
This means that you need to sell 200 items in the analyzed month to cover your costs. Once you step over the 200 T-shirts threshold you will start making a profit.
Once the breakeven number of units is determined, the company then knows what sales target it needs to set in order to generate profit and reach the company’s financial goals.
- The price of the product –with a given estimate of sales, variables and fixed costs per unit we need to determine the break even price. This method might be helpful in creating the pricing strategy.
Break-Even Price = 1 / ((1 – Total Variable Costs Percent per Unit)*(Total Fixed Costs per Unit))
In this case, we need to give an estimate for our sales volume. Let’s say, you are sure that you will sell 500 units in the upcoming month. You know that your average cost to purchase and deliver each T-shirt is $15. We can also call it your Cost of Sales. With a volume of 500 units, your COS will be $7,500. As we already mentioned fixed costs are $1,000 per month.
Variable Costs Percent per Unit = $7,500/($7,500+$1,000) = 88.24%
Also, we can easily calculate fixed costs per unit:
Fixed Costs per Unit = $1,000/500 = $2
So, your break-even price will be:
Break-Even Price = 1/(1-0.8824)*$2 = $17
We found out that you can’t set your price below $17.
To make your life easier we have prepared a free break even calculator. There is no need to memorize all these formulas, just enter your data and build your own scenarios!
What is a Break Even Graph?
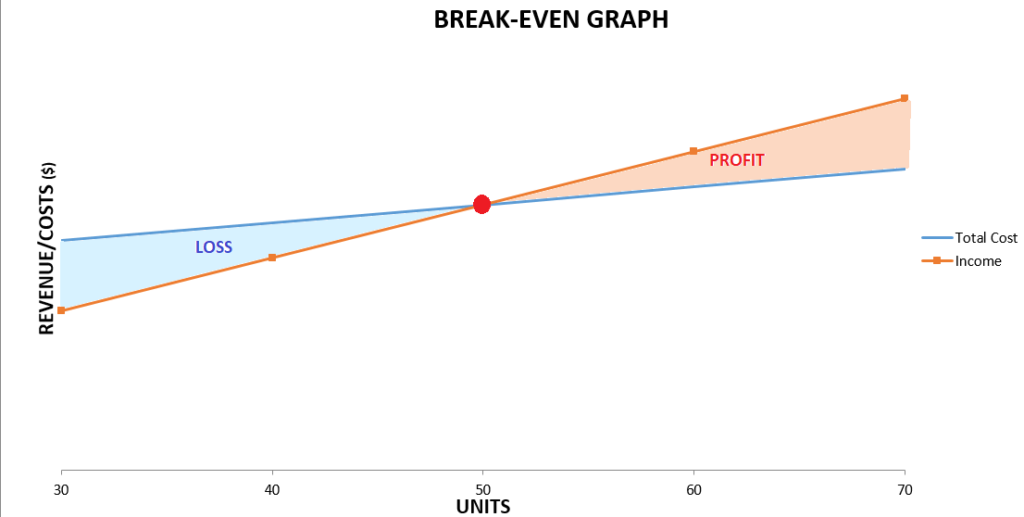
What does it tell us? The horizontal axis represents the volume of sold products while the vertical one – the dollar amount of income/costs. More sales are always associated with our total costs increase (due to the growth of the variable costs).
The break even point here is the spot where the revenue line and the total costs line are crossed.
The area to the right from the “no-loss-no-profit” point represents profit that a company will make while increasing sales.
The left hand area (highlighted with blue) shows the loss that the business will have if it not achieves the required sales volume.
“What if” analysis. How do various factors impact your business?
We are moving right now to the most important part! We’ve just learned how to calculate a break-even point to identify when you hit the threshold of profitability.
However, we can move further and model different scenarios for the business (you can use our template from the previous paragraph).
We can compare what impact each factor has (or a combination of them) and make smarter decisions based on them.
Let’s review a few examples.
1. Sales Price Change
Suppose, you own an online store and sell fitness trackers. Your current price is $50 per item. You know that the average price for the same device on the market is $60. Therefore, you expect that $5 price increase will not change the volume of sales. However, you want to do a research to discover what would happen to your break even point.
| Price Change Analysis | ||
| Current Price | New Price | |
| Sales Price per Item | $50.00 | $55.00 |
| Variable Cost per Item | $25.00 | $25.00 |
| Fixed Costs | $1 000.00 | $1 000.00 |
| Contribution Margin per Item | $25.00 | $30.00 |
| Break-even in Units | 40 | 34 |
| Break-even Sales ($) | $2 000.00 | $1 870.00 |
2. Variable Costs Change
Imagine that you are still selling fitness trackers for $50. However, you received a notification from your supplier that the wholesale price will increase by $5 per item starting from the next quarter. That’s a problem! At least you have enough time to prepare and make the following analysis:
| Variable Costs Change Analysis | ||
| Basic Scenario | Increased VC | |
| Sales Price per Item | $50.00 | $50.00 |
| Variable Cost per Item | $25.00 | $30.00 |
| Fixed Costs | $1 000.00 | $1 000.00 |
| Contribution Margin per Item | $25.00 | $20.00 |
| Break-even in Units | 40 | 50 |
| Break-even Sales ($) | $2 000.00 | $2 500.00 |
This change means that you will need to sell 10 items more each month to stay afloat.
3. Fixed Costs Changed
Let’s say you have decided to take a loan to purchase a lot more inventory. You will be obliged to repay $100 each month. It means that fixed costs will increase by this amount. Let’s take a look at its impact:
| Fixed Costs Change | ||
| Basic Scenario | New Costs | |
| Sales Price per Item | $50.00 | $50.00 |
| Variable Cost per Item | $25.00 | $25.00 |
| Fixed Costs | $1 000.00 | $1 100.00 |
| Contribution Margin per Item | $25.00 | $25.00 |
| Break-even in Units | 40 | 44 |
| Break-even Sales ($) | $2 000.00 | $2 200.00 |
The analysis shows that taking a loan will result in an increase in break even units (+4 items).
4. Changing Multiple Variables
Markets are not constant and conditions are changing rapidly. Usually, more than one factor is changing at the same time.
Suppose, you want to pass your fixed costs increase to customers and set a higher price. Here is what would happen in this case:
| Basic Scenario | Price + fixed costs increase | |
| Sales Price per Item | $50.00 | $53.00 |
| Variable Cost per Item | $25.00 | $25.00 |
| Fixed Costs | $1 000.00 | $1 100.00 |
| Contribution Margin per Item | $25.00 | $28.00 |
| Break-even in Units | 40 | 40 |
| Break-even Sales ($) | $2 000.00 | $2 120.00 |
So, we found out that we need to increase the price by $3 to save the BEP to be constant.
Further price increase will result in reducing the break even point. However, it is a risky practice as you may lose your customers.
Instead, it is worth looking through your fixed and variable costs. Costs optimization may be really vital.
However, there are several drawbacks of the break even analysis we need to mention:
- It is hard to apply it to multi-product businesses;
- It assumes that fixed costs are always constant. It is true in the short run, but sales increase usually cause fixed costs to grow.
- The results of the analysis may not be accurate because external factors couldn’t be taken into account.
We hope that you find this article helpful. Please comment below, we would be happy to hear your thoughts or questions.